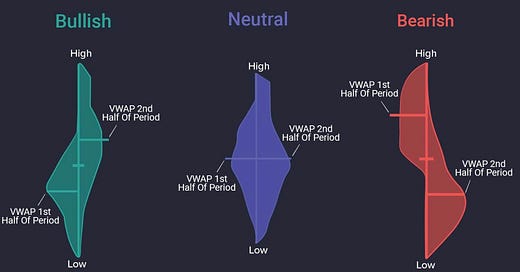
What are Raindrop Charts??
How to Find and Trade Raindrop Candles - Plus Screeners for profitable Investments/Trades
What are Raindrop Charts?
Raindrop Charts are a type of candlestick chart that combines price action, volume, and sentiment into a single visualization, giving traders a powerful tool. In this article, we will cover the origin of Raindrop Charts, how to read them, basic Raindrop patterns, and the advantages of using these charts.
Keep reading with a 7-day free trial
Subscribe to Holistic Traders to keep reading this post and get 7 days of free access to the full post archives.


