


Trading Pullbacks with Bill Williams Fractals: Tips and Strategies
Master the Art of Pullback Trading with Bill Williams Fractals

A holistic approach to trading means taking care of the body, mind, and spirit. This includes managing risk, developing a simple strategy, and being fully present in the moment." - Brett Steenbarger
Bill Williams fractals are one of the most popular tools used by traders to identify pullback trading opportunities. These fractals can be used to identify potential market reversals and help traders enter trades at the right time. In this substack, we'll discuss how to use Bill Williams fractals to improve your trading strategy and maximize your profits.
Understanding Bill Williams Fractals
As a taken a Holistic traders approach , I believe that trading is more than just about making money. It's also about understanding the market, having a simple strategy, and managing risk. That's why I find Bill Williams Fractals to be a useful tool in my trading arsenal.
Bill Williams Fractals are a technical analysis tool that can help traders identify potential market reversals. They use geometric patterns to pinpoint key levels of support and resistance, which can be helpful in anticipating trend changes.
Fractals are formed by a series of five consecutive bars, where the middle bar has the highest high or the lowest low of the series. A bullish fractal forms when the middle bar has a higher high than the two bars on either side of it, and a bearish fractal forms when the middle bar has a lower low than the two bars on either side of it.
When used in conjunction with other technical indicators, Bill Williams Fractals can provide confirmation of trading signals. For example, a bullish fractal may indicate a potential buy signal if it forms near a support level or in an uptrend. Conversely, a bearish fractal may indicate a potential sell signal if it forms near a resistance level or in a downtrend.

The simplicity and versatility of Bill Williams Fractals make them a popular tool among traders. They can be applied to any timeframe or market, which allows traders to customize their strategy to fit their specific trading style. By using Bill Williams Fractals as part of a holistic approach to trading, traders can better manage risk, identify high-probability trading opportunities, and make more informed decisions.
How Do They Work?
Bill Williams Fractals work by identifying key levels of support and resistance in the market. They do this by analyzing the price action of a given asset and looking for patterns that suggest a potential trend reversal.
As I mentioned earlier, a fractal is formed by a series of five consecutive bars, where the middle bar has the highest high or the lowest low of the series. A bullish fractal forms when the middle bar has a higher high than the two bars on either side of it, and a bearish fractal forms when the middle bar has a lower low than the two bars on either side of it.
When a bullish fractal forms, it suggests that the market is potentially moving from a downtrend to an uptrend. Conversely, when a bearish fractal forms, it suggests that the market is potentially moving from an uptrend to a downtrend. Traders can use these fractals as potential buy or sell signals, depending on the direction of the trend.
It's important to note that Bill Williams Fractals are not a standalone trading strategy, but rather a tool that can be used in conjunction with other technical analysis indicators. They work best when combined with other indicators that can confirm or refute the potential signal provided by the fractal.
In summary, Bill Williams Fractals work by analyzing the price action of a given asset and identifying key levels of support and resistance. They can be used as potential buy or sell signals, depending on the direction of the trend, but should be combined with other technical analysis tools for optimal results.
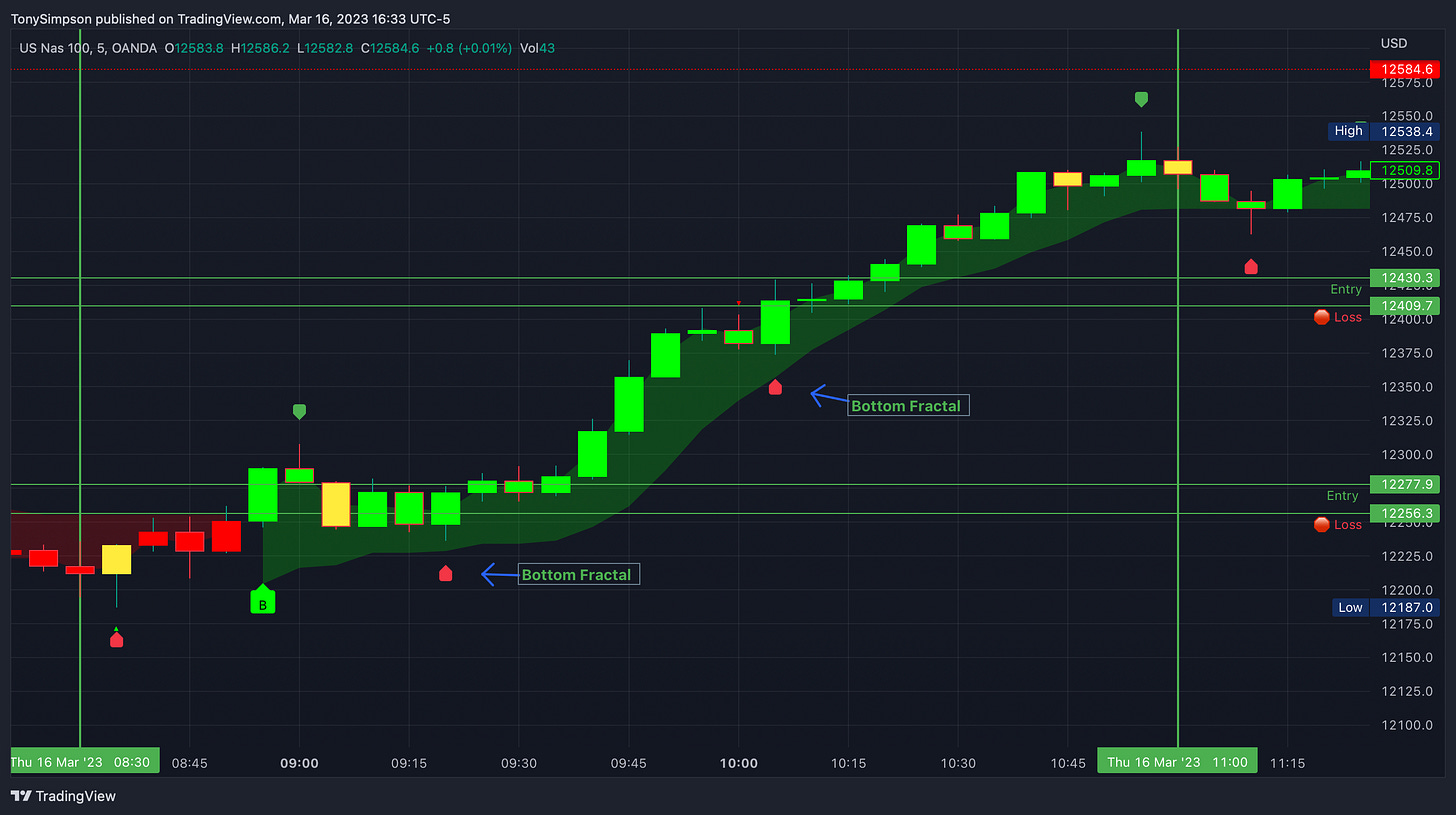
As you see below Support and Resistance.

A Moment for our sponsor…
Introducing the perfect addition to your wardrobe: the Immaculate Experiences Light Bulb Tee! Made with high-quality materials, this tee is not only comfortable, but it also features a unique design that will turn heads. Whether you're out with friends or running errands, this tee is perfect for any occasion. And the best part? You can support a small business while looking great! Don't miss out on this must-have item, get your Immaculate Experiences Light Bulb Tee today.

Why are they important in pullback Trading?
Bill Williams Fractals are important for pullback trading because they can help traders identify potential areas of support or resistance in a market that is moving in the opposite direction of the prevailing trend. In other words, they can help traders identify when a market is potentially undergoing a temporary retracement within a larger trend.
When using Bill Williams Fractals for pullback trading, traders typically look for a bullish fractal in an uptrend or a bearish fractal in a downtrend. Once a fractal has been identified, traders can use it as a potential entry signal, with the expectation that the market will eventually resume its larger trend.
For example, let's say a trader is bullish on a stock that has been in an uptrend for several weeks. However, the stock experiences a temporary pullback and starts to move in a downward direction. The trader can use Bill Williams Fractals to identify potential areas of support where the stock might find a bottom and start to reverse direction. If a bullish fractal forms near one of these support levels, it could provide a potential entry signal for the trader to buy the stock, with the expectation that it will eventually resume its upward trend.
Similarly, if a trader is bearish on a stock that has been in a downtrend for several weeks, they can use Bill Williams Fractals to identify potential areas of resistance where the stock might find a top and start to reverse direction. If a bearish fractal forms near one of these resistance levels, it could provide a potential entry signal for the trader to sell the stock short, with the expectation that it will eventually resume its downward trend.
In summary, Bill Williams Fractals are important for pullback trading because they can help traders identify potential areas of support or resistance where a market may temporarily reverse direction before resuming its larger trend. By using fractals as part of a larger trading strategy, traders can potentially increase their profitability and manage risk more effectively.
What is a bottom fractal?
A bottom fractal is a specific type of fractal that can form during a potential uptrend in a financial market. It consists of a series of five consecutive bars, where the middle bar has the lowest low of the series and is surrounded by two bars with higher lows on either side.
In other words, a bottom fractal occurs when the market has reached a potential bottom or support level, and is starting to reverse its direction. The middle bar with the lowest low represents the lowest point of the market's potential retracement, and the two bars on either side with higher lows suggest that the market may be starting to move in an upward direction again.
Bottom fractals can be an important signal for traders who are using Bill Williams Fractals to identify potential areas of support or resistance. When a bottom fractal forms, it can suggest that the market has reached a temporary bottom and is potentially ready to resume its larger uptrend. Traders can use this signal as a potential entry point to buy the asset in question, with the expectation that it will continue to move in an upward direction.
As with any technical analysis tool, traders should use them in conjunction with other indicators and analysis methods to make informed trading decisions. Additionally, bottom fractals may sometimes be false signals or lead to market reversals that don't materialize as expected.
How to identify a bottom fractal in an uptrend
A top fractal is a pattern in price action that can occur in a downtrend. It consists of five consecutive bars, where the middle bar has the highest high of the series and is surrounded by two bars with lower highs on either side. Here are the characteristics of a top fractal:
Look for a potential uptrend in the market. This means that the market should have been moving in an upward direction for some time, with higher highs and higher lows forming a general uptrend pattern.
Look for a retracement or pullback within the uptrend. This is a temporary move in the opposite direction of the trend, where prices may drop before potentially resuming the uptrend.
Identify a series of five consecutive bars within the retracement. The middle bar of this series should have the lowest low of the series.
Check that the two bars on either side of the middle bar have higher lows than the middle bar. This indicates that the market may be starting to move upward again, potentially resuming the overall uptrend.
Once this pattern is identified, confirm the fractal by looking for a price bar that has higher high than the middle bar in the fractal series. This is called the confirmation bar, and it can help confirm that the market has indeed reversed direction and is potentially resuming the uptrend.

Trading strategies using bottom fractals
Buy at the Retest: Traders can also use the formation of a bottom fractal as a signal to enter a long position when the market retraces back to retest the level of the fractal. This can provide an additional confirmation that the fractal has formed a support level, and the market is likely to resume its upward movement.
Place Stop Loss Below Fractal: When entering a long position based on a bottom fractal, traders should always place a stop loss order below the level of the fractal. This helps to limit potential losses if the market fails to resume its upward movement, and instead continues to drop lower.
What is a top fractal?
It consists of five consecutive bars, with the middle bar having the highest high of the series.
The two bars on either side of the middle bar have lower highs.
It typically occurs during a downtrend, indicating that the market may be reversing and potentially starting an uptrend.
It can be used by traders as a signal to enter short positions in the market.
Like a bottom fractal, a top fractal can be confirmed when a price bar forms with a lower high than the middle bar in the fractal series.

How to identify a top fractal in a downtrend
Look for a series of five consecutive bars in a downtrend.
Identify the middle bar of the series, which should have the highest high of the five bars.
Look at the two bars on either side of the middle bar, which should have lower highs than the middle bar.
Confirm the top fractal by waiting for a price bar to form with a lower high than the middle bar in the fractal series.

Trading strategies using top fractals
Sell at the Retest: Traders can also use the formation of a top fractal as a signal to enter a short position when the market retraces back to retest the level of the fractal. This can provide an additional confirmation that the fractal has formed a resistance level, and the market is likely to resume its downward movement.
Place Stop Loss Above Fractal: When entering a short position based on a top fractal, traders should always place a stop loss order above the level of the fractal. This helps to limit potential losses if the market fails to resume its downward movement, and instead continues to move higher.
Trading Strategy - >
Keep reading with a 7-day free trial
Subscribe to Holistic Traders to keep reading this post and get 7 days of free access to the full post archives.